One location, one FBT year, two independent surveys. You get the rate and everything behind it, in a form that sits straight into an FBT workpaper file.
| Location | Benefit period | Opening rate | Opening station | Closing rate | Closing station | Average |
|---|---|---|---|---|---|---|
| 45 Kestrel Street, Milton QLD | 01/04/25 – 31/03/26 | $8.50casual all-day | Quarry Street Open Air | $9.20casual all-day | Quarry Street Open Air | $8.85 |
| 12 Ardenne Street, Woolloongabba QLD | 01/04/25 – 31/03/26 | $9.16monthly ÷ 19 bd | Pacific Lane Car Park | $8.55monthly ÷ 22 bd | Pacific Lane Car Park | $8.86 |
| 8 Mill Street, Regional QLD | 01/04/25 – 31/03/26 | No commercial parking station within a 1 km practicable radius charging above the statutory threshold | Nil | |||
Illustrative extract. Every location, car park and rate shown is invented, and no figure here is a determination for any client. The same worked example runs through the sample report.
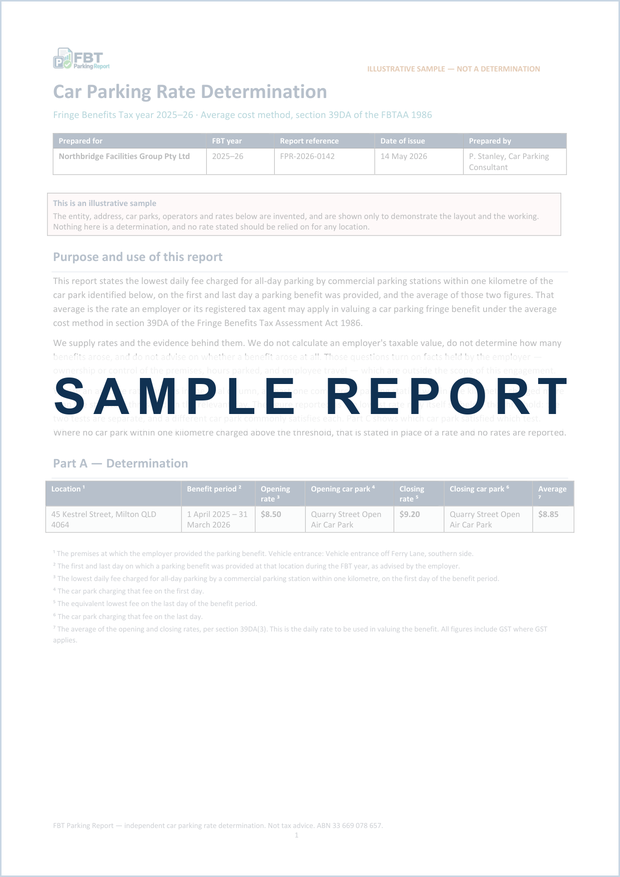
Four pages: the determination above, every car park considered including the ones we rejected and why, the arithmetic behind each rate, and the basis for all of it.
Sample report (PDF)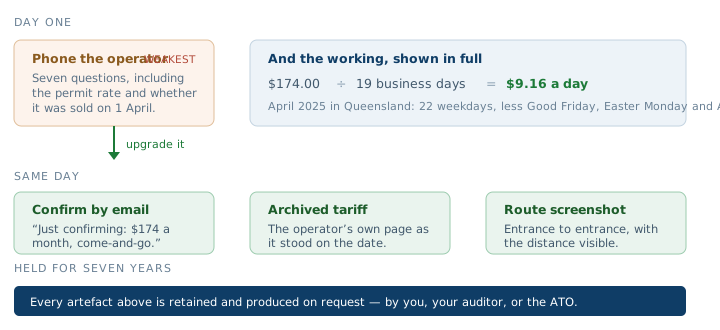
We are explicit about where each rate came from, because the strength of the evidence is the strength of your position. A rate we could only obtain by phone is labelled as such.
The operator’s own published rates as they stood on the exact date, retrieved from a dated web archive.
Self-dating URL + timestamp
Permit and unpublished rates confirmed by the operator by email, including confirmation of the historical date.
Email held on file
The live tariff board or rate page, captured and dated, corroborating rate stability across the period.
Screenshot + URL + capture date
Where nothing else exists. Always followed the same day by a written confirmation back to the operator.
File note: date, time, name
One location, one FBT year. Opening and closing survey, full evidence pack, next business day.
For multi-site employers and accounting firms ordering across a client book.
Give us the car park address and the dates a benefit was provided. We survey the rest and come back by close of business the next business day.